A worked ad example
This is a fictional design created for this tutorial. The map is an actual UNISAL v1 prediction using MIT1003 weights, calculated from the image shown here.
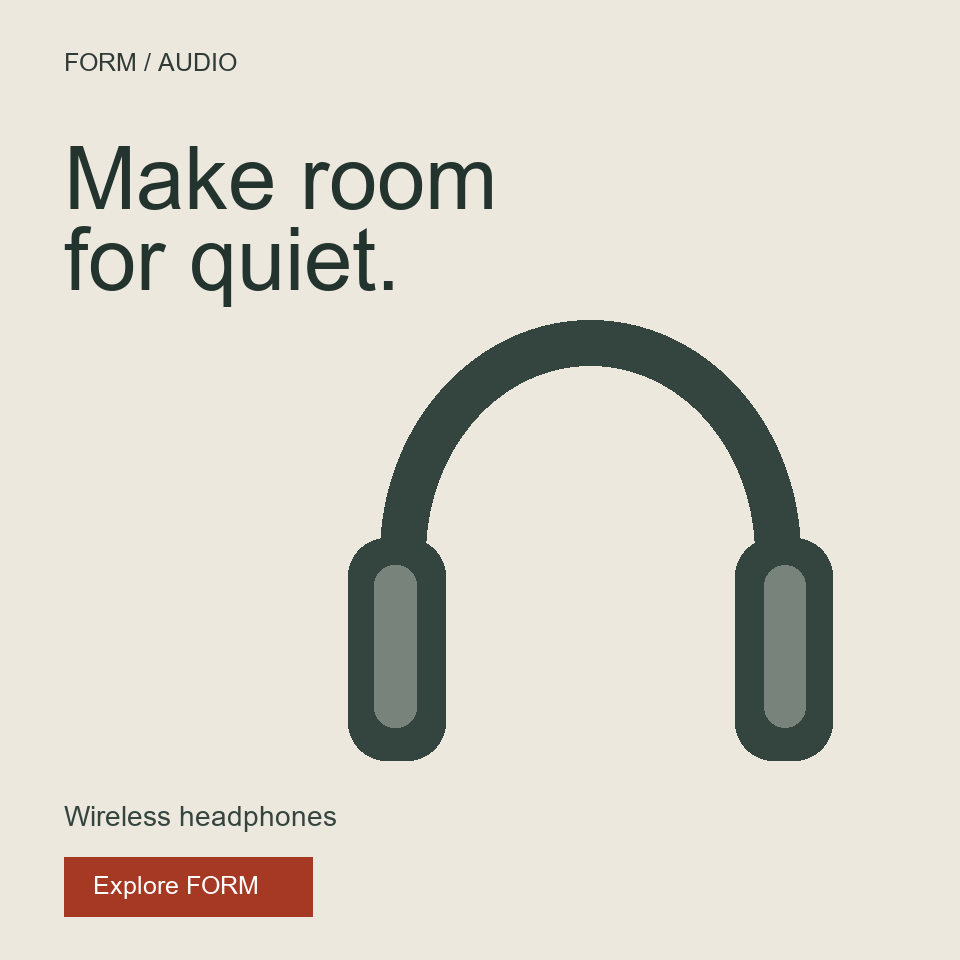
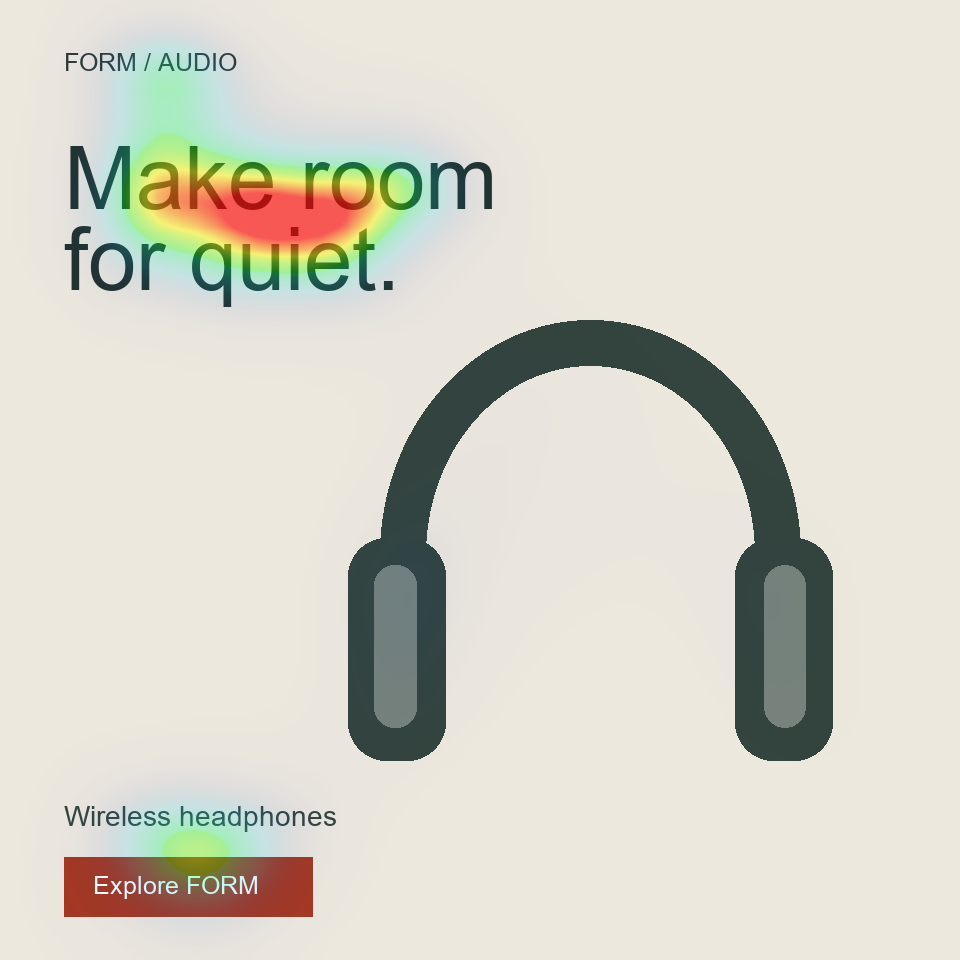
Download the example input to try the workflow. Your comparison should use variants of this same format and purpose.
Three questions for your creative
The analysis concerns the image you upload. It does not simulate an entire Meta, Reddit or TikTok feed unless that surrounding context is actually present in the input. A mockup alone would not measure how a scrolling audience reacts.
- Product: is the main subject identifiable, or does the background compete with it?
- Offer: does the visual emphasis support the message you want people to understand?
- Action and brand: are they legible at the size the creative will be displayed?
Prepare an interpretable upload
Use the intended aspect ratio and include the final text. Upload a PNG, JPEG or WebP up to 8 MB. Initial public analysis has a daily limit. Images are processed on the server and this creative tool stores the original and result, accessible through result URLs.
References: Data handling before you upload
Read the map, then revise one element
Suppose the decoration is more prominent than the product. Try changing the crop or simplifying the background while keeping the offer fixed. Export both versions at the same size and compare them in Championship.
The tips shown by this tool are rule-based prompts derived from summary metrics. They are not a semantic audit of your actual headline, product or audience. A warm area may overlap those elements, but the model does not know their business role.
References: Compare the original and revision
A score is not a media-buying forecast
This tool does not predict CTR, ROAS, thumb-stop rate or sales. The visual is only one part of an ad's performance; audience, placement, offer and delivery matter too. Use the prediction to formulate a visual hypothesis and assess the actual campaign with appropriate evidence.