From your image to a heatmap
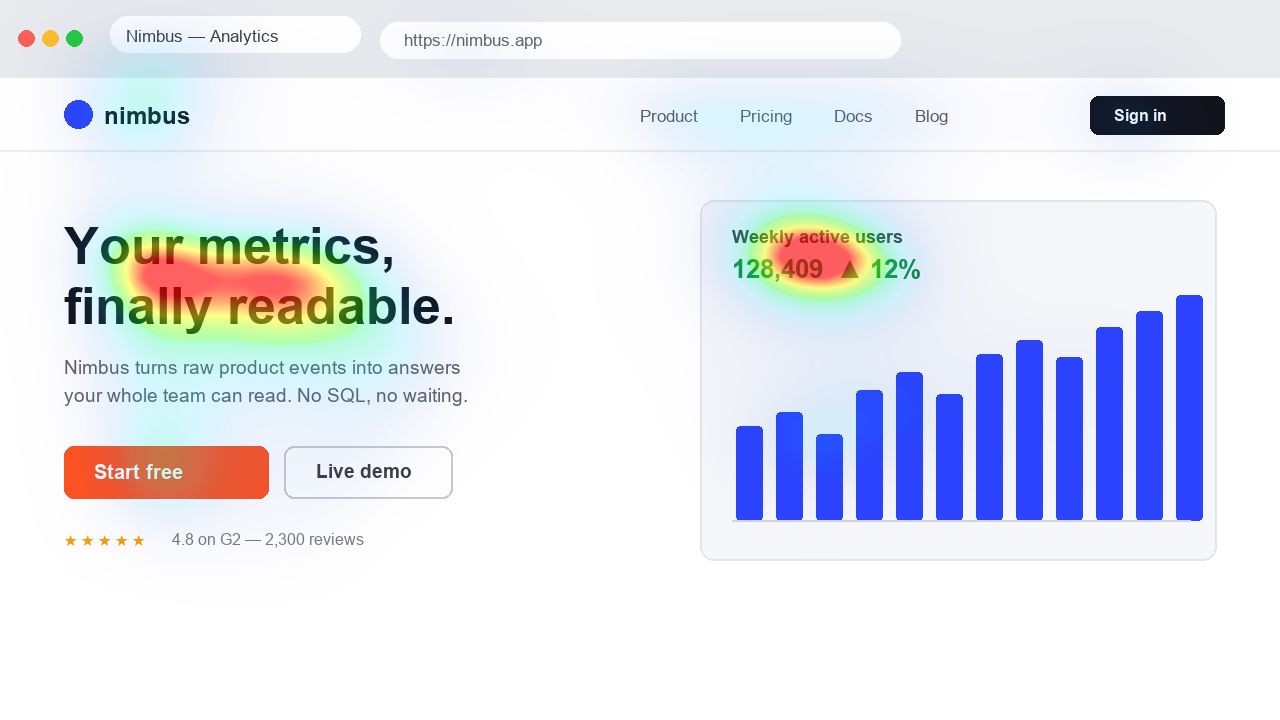
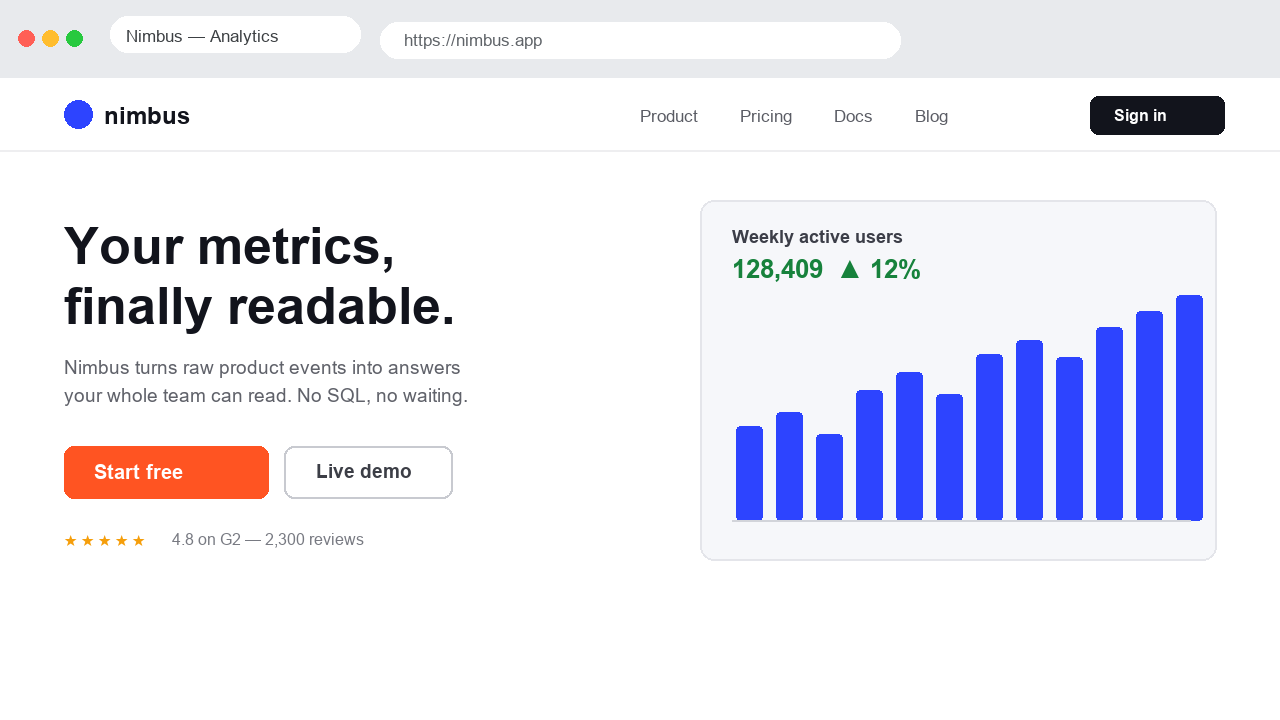
The generator analyses a still image with UNISAL. No visitor traffic is needed, so you can review a design before it is published. This is an attention prediction, not a click heatmap, a Wi-Fi coverage map or a chart of numerical data.
- Choose a PNG, JPEG or WebP up to 10 MB. Use the actual aspect ratio and include the surrounding layout.
- Upload the image and wait for the prediction. Processing happens on the server.
- Move the comparison slider to inspect the original and the overlay.
- Download the result, or select multiple images to continue in Championship.
What the colours tell you
Warmer areas indicate stronger relative saliency in this image. They are not counts of people, click probabilities or a sequence of eye movements. A decorative detail can be prominent without helping your message.
Start with a specific question: does the product compete with the background, or is the headline visually overshadowed? The useful result is an observation you can act on, not a target score to maximise.
References: How to analyse a heatmap
Pick the workflow for your design
For a website already open in your browser, the Chrome extension captures the visible tab and refreshes the overlay after scrolling or resizing. For a Figma frame, export an image and upload it here; the Figma plugin is not available yet.
References: Chrome live heatmaps · Figma export workflow · Ad creative analysis · Thumbnail analysis
Free access and data handling
Initial image analysis is available without creating an account. Usage limits apply and the tool indicates when your allowance has been reached. A free account has its own access conditions; Pro is coming soon.
Images are uploaded for processing. Account media features can save reduced previews, and some creative-analysis tools store results. Read the privacy policy before submitting confidential material.
References: Access and pricing · Privacy policy
Can this predict conversions?
No. Attention is not comprehension, preference or purchase intent. Use the map to compare visual hypotheses and validate important decisions with people or a suitable live experiment. Keep the same dimensions and tool settings when comparing variants.